class: right, top, my-title, title-slide # An Example to Remember ### Jo Hardin ### March 24, 2022 --- ## Bias in a model ``` talent ~ Normal (100, 15) grades ~ Normal (talent, 15) SAT ~ Normal (talent, 15) ``` College wants to admit students with > `talent > 115` ... but the college only has access to `grades` and `SAT` which are noisy estimates of `talent`. The example is taken directly (and mostly verbatim) from a blog by Aaron Roth [Algorithmic Unfairness Without Any Bias Baked In](http://aaronsadventures.blogspot.com/2019/01/discussion-of-unfairness-in-machine.html). --- ## Plan for accepting students * Run a regression on a training dataset (`talent` is known for existing students) * Find a model which predicts `talent` based on `grades` and `SAT` * Choose students for whom predicted `talent` is above 115 --- ## Flaw in the plan ... * there are two populations of students, the Reds and Blues. * Reds are the majority population (99%) * Blues are a small minority population (1%) * the Reds and the Blues are no different when it comes to talent: they both have the same talent distribution, as described above. * there is no bias baked into the grading or the exams: both the Reds and the Blues also have exactly the same grade and exam score distributions -- > But there is one difference: the Blues have more money than the Reds, so they each take the **SAT twice**, and report only the highest of the two scores to the college. > Taking the test twice results in a small but noticeable bump in the average SAT scores of the Blues, compared to the Reds. --- ## Key insight: > The value of `SAT` means something different for the Reds versus the Blues (They have different feature distributions.) --- ## Let's see what happens ... 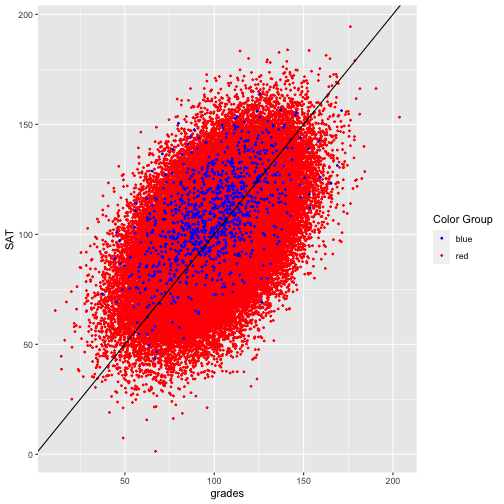<!-- --> --- ## Two models: Red model (SAT taken once): ``` ## # A tibble: 3 × 5 ## term estimate std.error statistic p.value ## <chr> <dbl> <dbl> <dbl> <dbl> ## 1 (Intercept) 33.4 0.152 220. 0 ## 2 SAT 0.332 0.00149 223. 0 ## 3 grades 0.333 0.00150 223. 0 ``` Blue model (SAT is max score of two): ``` ## # A tibble: 3 × 5 ## term estimate std.error statistic p.value ## <chr> <dbl> <dbl> <dbl> <dbl> ## 1 (Intercept) 24.2 1.52 15.9 8.47e- 51 ## 2 SAT 0.430 0.0154 27.9 6.53e-127 ## 3 grades 0.291 0.0142 20.5 3.15e- 78 ``` --- ## New data * Generate new data and use the **two** models above, separately. * How well do the models predict if a student has `talent` > 115? 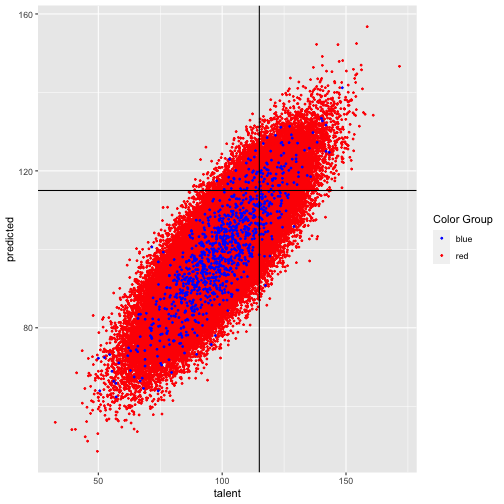<!-- --> --- ## New data .pull-left[ <!-- --> ] .pull-right[ <table> <thead> <tr> <th style="text-align:left;"> color </th> <th style="text-align:right;"> tpr </th> <th style="text-align:right;"> fpr </th> <th style="text-align:right;"> error </th> </tr> </thead> <tbody> <tr> <td style="text-align:left;"> blue </td> <td style="text-align:right;"> 0.510 </td> <td style="text-align:right;"> 0.044 </td> <td style="text-align:right;"> 0.113 </td> </tr> <tr> <td style="text-align:left;"> red </td> <td style="text-align:right;"> 0.504 </td> <td style="text-align:right;"> 0.037 </td> <td style="text-align:right;"> 0.109 </td> </tr> </tbody> </table> `$$\texttt{tpr} = \frac{\mbox{true positives}}{\mbox{all who should}}$$` `$$\texttt{fpr} = \frac{\mbox{false positives}}{\mbox{all who should not}}$$` ] --- ## **TWO** models doesn't seem right???? What if we fit only one model to the entire dataset? After all, there are laws against using protected classes to make decisions (housing, jobs, credit, loans, college, etc.) ``` ## # A tibble: 3 × 5 ## term estimate std.error statistic p.value ## <chr> <dbl> <dbl> <dbl> <dbl> ## 1 (Intercept) 33.4 0.151 221. 0 ## 2 SAT 0.332 0.00148 224. 0 ## 3 grades 0.334 0.00149 224. 0 ``` (The coefficients kinda look like the red model...) --- ## How do the error rates change? .pull-left[ 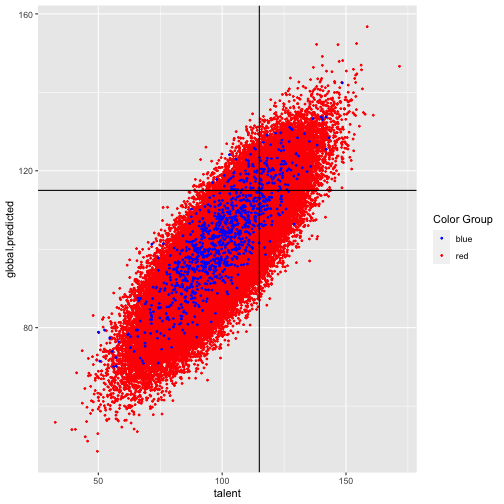<!-- --> ] .pull-right[ One model: <table> <thead> <tr> <th style="text-align:left;"> color </th> <th style="text-align:right;"> tpr </th> <th style="text-align:right;"> fpr </th> <th style="text-align:right;"> error </th> </tr> </thead> <tbody> <tr> <td style="text-align:left;"> blue </td> <td style="text-align:right;"> 0.613 </td> <td style="text-align:right;"> 0.063 </td> <td style="text-align:right;"> 0.113 </td> </tr> <tr> <td style="text-align:left;"> red </td> <td style="text-align:right;"> 0.502 </td> <td style="text-align:right;"> 0.037 </td> <td style="text-align:right;"> 0.109 </td> </tr> </tbody> </table> Two separate models: <table> <thead> <tr> <th style="text-align:left;"> color </th> <th style="text-align:right;"> tpr </th> <th style="text-align:right;"> fpr </th> <th style="text-align:right;"> error </th> </tr> </thead> <tbody> <tr> <td style="text-align:left;"> blue </td> <td style="text-align:right;"> 0.510 </td> <td style="text-align:right;"> 0.044 </td> <td style="text-align:right;"> 0.113 </td> </tr> <tr> <td style="text-align:left;"> red </td> <td style="text-align:right;"> 0.504 </td> <td style="text-align:right;"> 0.037 </td> <td style="text-align:right;"> 0.109 </td> </tr> </tbody> </table> ] --- ## What did we learn? > with two populations that have different feature distributions, learning a single classifier (that is prohibited from discriminating based on population) will fit the bigger of the two populations * depending on the nature of the distribution difference, it can be either to the benefit or the detriment of the minority population * no explicit human bias, either on the part of the algorithm designer or the data gathering process * the problem is exacerbated if we artificially force the algorithm to be group blind * well intentioned "fairness" regulations prohibiting decision makers form taking sensitive attributes into account can actually make things less fair and less accurate at the same time --- ## Simulate? * different varying proportions * effect due to variability * effect due to SAT coefficient * different number of times the blues get to take the test * etc.